「グラフ系のライブラリの使用経験が薄いな」と感じたので、今回は plotly.js を vue.js に組み込んで表示を試みてみます。
参考 準備 今回も vite を使って初期設定していきます。
1
2
3
4
5
6
7
8
9
10
11
12
13
npm init @vitejs/app app --template vue-ts cd appnpm install npm install plotly.js-dist-min npm install @types/plotly.js npm run dev
実装 シンプルに、グラフを描画 それでは具体的実装です。
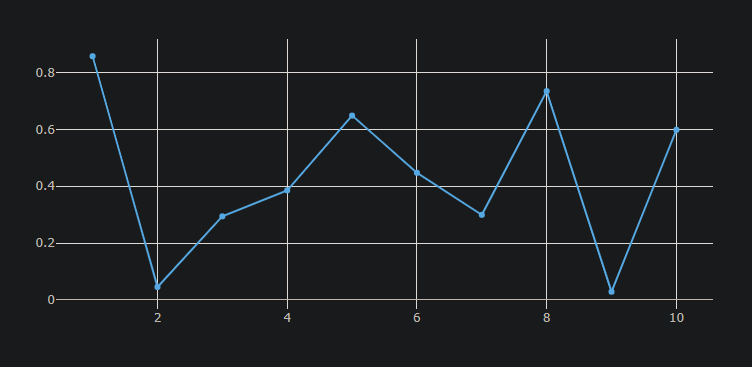
src/components/Graph.vue 1 2 3 4 5 6 7 8 9 10 11 12 13 14 15 16 17 18 19 20 21 22 23 24 25 26 27 28 29 30 31 32 33 34 35 36 37 38 39 40 <template > <div ref ="graph" > </div > </template > <script lang ="ts" > import { defineComponent, onMounted, reactive, ref, watch } from "vue" ; import Plotly from "plotly.js-dist-min" ; export default defineComponent ({ setup ( const graph = ref<HTMLDivElement >(); const data = reactive ([ { x : [1 , 2 , 3 , 4 , 5 , 6 , 7 , 8 , 9 , 10 ], y : [1 , 2 , 3 , 4 , 5 , 6 , 7 , 8 , 9 , 10 ], }, ]); onMounted (() => { if (!graph.value ) return ; Plotly .newPlot (graph.value , data); }); setInterval (() => { data[0 ].y [3 ] += 1 ; for (let i = 0 ; i < data[0 ].y .length ; i++) { data[0 ].y [i] = Math .random (); } }, 2000 ); watch (data, () => { if (!graph.value ) return ; Plotly .redraw (graph.value ); }); return { graph }; }, }); </script >
2 秒ごとに、グラフが適当に書き換わります。
データは親から渡すパターン コンポーネントはグラフ描画だけで、データは親から渡すパターンも試しました。
src/components/Graph.vue 1 2 3 4 5 6 7 8 9 10 11 12 13 14 15 16 17 18 19 20 21 22 23 24 25 26 27 28 29 30 31 32 <template > <div ref ="graph" > </div > </template > <script lang ="ts" > import { defineComponent, onMounted, ref, watch, PropType } from "vue" ; import Plotly from "plotly.js-dist-min" ; export default defineComponent ({ props : { data : { type : Array as PropType <Plotly .Data []>, default : () => [], required : true , }, }, setup (props ) { const graph = ref<HTMLDivElement >(); onMounted (() => { if (!graph.value ) return ; Plotly .newPlot (graph.value , props.data ); }); watch (props.data , () => { if (!graph.value ) return ; Plotly .redraw (graph.value ); }); return { graph }; }, }); </script >
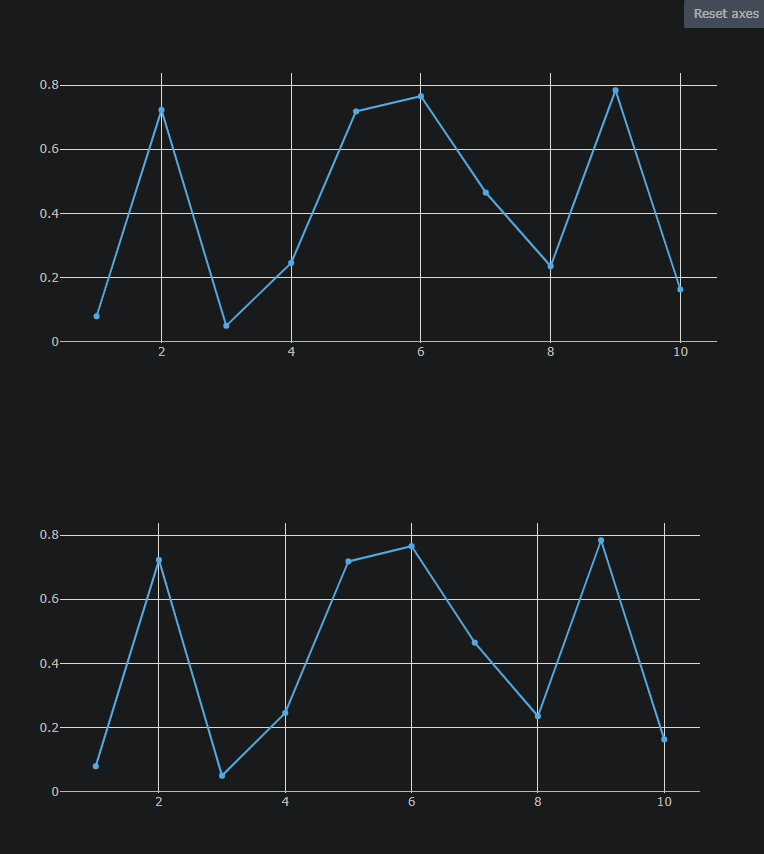
親コンポーネントで、グラフ用のコンポーネントに同じデータを渡してみます。
src/App.vue 1 2 3 4 5 6 7 8 9 10 11 12 13 14 15 16 17 18 19 20 21 22 23 24 25 26 27 28 29 30 31 32 33 34 35 36 37 38 39 40 41 42 43 44 45 46 47 <template > <Graph :data ="data" /> <Graph :data ="data" /> </template > <script lang ="ts" > import { defineComponent, reactive } from "vue" ; import Graph from "./components/Graph.vue" ; import BarGraph from "./components/BarGraph.vue" ; export default defineComponent ({ name : "App" , components : { Graph , BarGraph , }, setup ( const data = reactive ([ { x : [1 , 2 , 3 , 4 , 5 , 6 , 7 , 8 , 9 , 10 ], y : [1 , 2 , 3 , 4 , 5 , 6 , 7 , 8 , 9 , 10 ], }, ]); setInterval (() => { data[0 ].y [3 ] += 1 ; for (let i = 0 ; i < data[0 ].y .length ; i++) { data[0 ].y [i] = Math .random (); } }, 2000 ); return { data }; }, }); </script > <style > #app { font-family : Avenir, Helvetica, Arial, sans-serif; -webkit-font-smoothing : antialiased; -moz-osx-font-smoothing : grayscale; text-align : center; color : #2c3e50 ; margin-top : 60px ; } </style >
同じデータ内容で、複数のグラフを表示できました。
別のグラフのパターンも試す データを親コンポーネントから渡すようにしたので、テータを少し加工して複数種類のグラフを表示できるはず。
src/components/BarGraph.vue 1 2 3 4 5 6 7 8 9 10 11 12 13 14 15 16 17 18 19 20 21 22 23 24 25 26 27 28 29 30 31 32 33 34 35 36 37 38 39 40 41 42 43 44 45 46 47 <template > <div ref ="graph" > </div > </template > <script lang ="ts" > import { defineComponent, onMounted, ref, toRef, watch, PropType } from "vue" ; import Plotly from "plotly.js-dist-min" ; export default defineComponent ({ props : { data : { type : Array as PropType <Plotly .Data []>, default : () => [], required : true , }, }, setup (props ) { const graph = ref<HTMLDivElement >(); let data : Plotly .Data [] = []; const createData = ( let d = Object .assign ({}, toRef (props.data , 0 ).value ); d.type = "bar" ; data.pop (); data.push (d); }; onMounted (() => { createData (); if (!graph.value ) return ; Plotly .newPlot (graph.value , data); }); watch (props.data , () => { createData (); if (!graph.value ) return ; Plotly .redraw (graph.value ); }); return { graph }; }, }); </script >
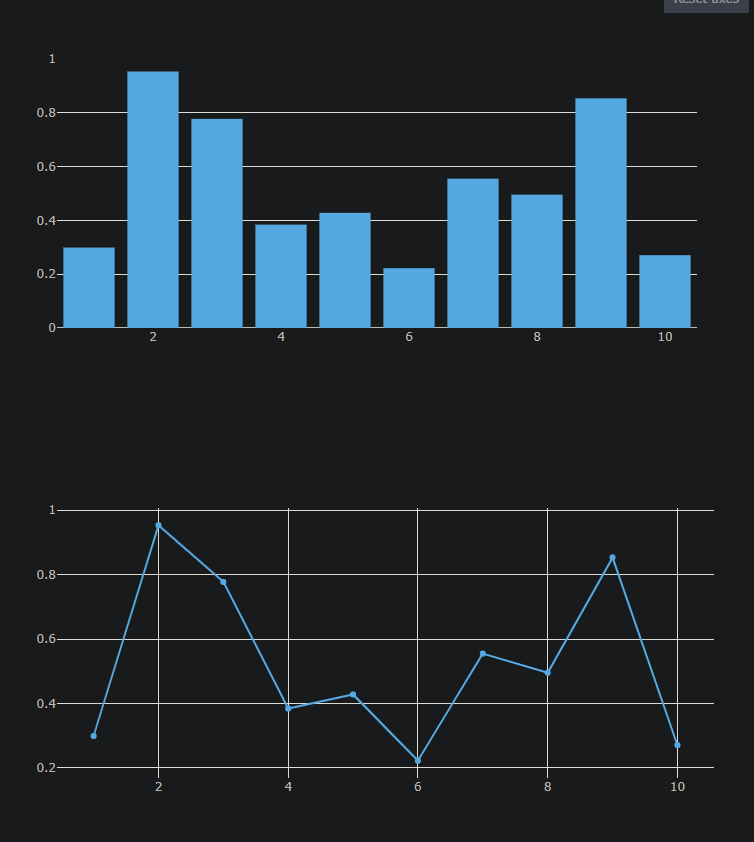
データを渡す親コンポーネントで作った棒グラフ用のコンポーネントにも同じデータを渡します。
src/App.vue 1 2 3 4 5 6 7 8 9 10 11 12 13 14 15 16 17 18 19 20 21 22 23 24 25 26 27 28 29 30 31 32 33 34 35 36 37 38 39 40 41 42 43 44 45 46 <template > <Bar-Graph :data ="data" /> <Graph :data ="data" /> </template > <script lang ="ts" > import { defineComponent, reactive } from "vue" ; import Graph from "./components/Graph.vue" ; import BarGraph from "./components/BarGraph.vue" ; export default defineComponent ({ name : "App" , components : { Graph , BarGraph , }, setup ( const data = reactive ([ { x : [1 , 2 , 3 , 4 , 5 , 6 , 7 , 8 , 9 , 10 ], y : [1 , 2 , 3 , 4 , 5 , 6 , 7 , 8 , 9 , 10 ], }, ]); setInterval (() => { data[0 ].y [3 ] += 1 ; for (let i = 0 ; i < data[0 ].y .length ; i++) { data[0 ].y [i] = Math .random (); } }, 2000 ); return { data }; }, }); </script > <style > #app { font-family : Avenir, Helvetica, Arial, sans-serif; -webkit-font-smoothing : antialiased; -moz-osx-font-smoothing : grayscale; text-align : center; color : #2c3e50 ; margin-top : 60px ; } </style >
同じデータで複数種類のグラフを表示できました。
API からデータを取得して描画する 最後に、API からデータを取得して描画してみます。
適当なディレクトリで、データ配信サーバーとして json-server の設定をします。
1
2
npm install --save-dev json-server npx json-server --watch db.json --routes routes.json
db.json と routes.json は次のようにしました。
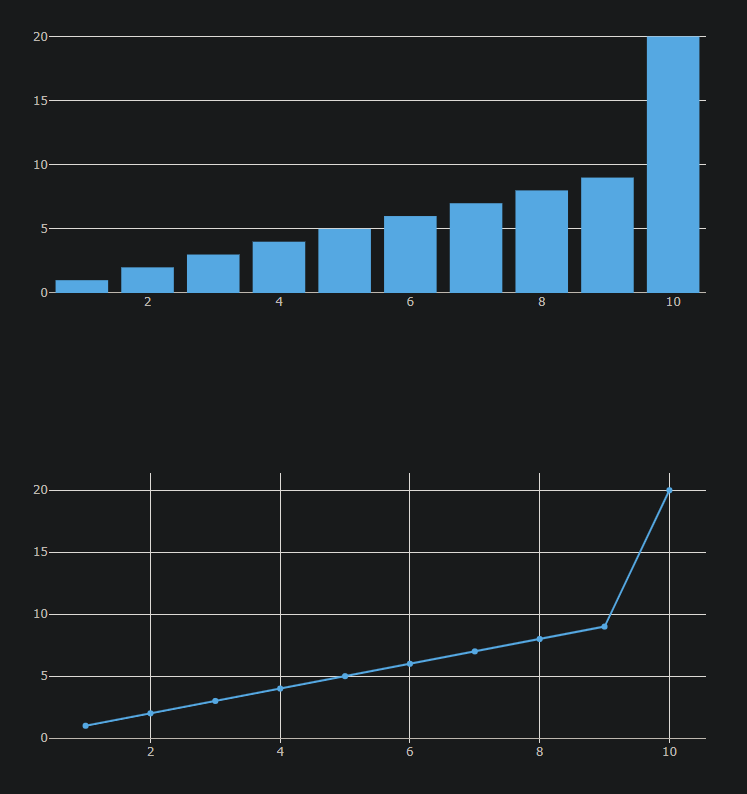
db.json 1 2 3 4 5 6 { "data" : { "x" : [ 1 , 2 , 3 , 4 , 5 , 6 , 7 , 8 , 9 , 10 ] , "y" : [ 1 , 2 , 3 , 4 , 5 , 6 , 7 , 8 , 9 , 20 ] } }
routes.json vite の、proxy 設定を入れます。
app/vite.config.ts 1 2 3 4 5 6 7 8 9 10 11 12 13 14 15 16 17 18 import { defineConfig } from "vite" ;import vue from "@vitejs/plugin-vue" ;export default defineConfig ({ plugins : [vue ()], server : { port : 4001 , proxy : { "/api" : { target : "http://localhost:3000" , changeOrigin : true , rewrite : (path ) => path.replace (/^\/api/ , "" ), }, }, }, });
データ取得の実装はこちら。
src/App.vue 1 2 3 4 5 6 7 8 9 10 11 12 13 14 15 16 17 18 19 20 21 22 23 24 25 26 27 28 29 30 31 32 33 34 35 36 37 38 39 40 41 42 43 44 45 <template > <Bar-Graph :data ="data" /> <Graph :data ="data" /> <Graph :data ="data" /> </template > <script lang ="ts" > import { defineComponent, reactive, onMounted } from "vue" ; import Graph from "./components/Graph.vue" ; import BarGraph from "./components/BarGraph.vue" ; import Plotly from "plotly.js-dist-min" ; export default defineComponent ({ name : "App" , components : { Graph , BarGraph , }, setup ( const data : Plotly .Data [] = reactive ([]); onMounted (async () => { const result = await (await fetch ("/api/data" )).json (); if (!result) return ; data.push (result); }); return { data }; }, }); </script > <style > #app { font-family : Avenir, Helvetica, Arial, sans-serif; -webkit-font-smoothing : antialiased; -moz-osx-font-smoothing : grayscale; text-align : center; color : #2c3e50 ; margin-top : 60px ; } </style >
/api/data から取得した内容を元に、グラフの描画をできました。
vite で前から気になっていたことですが、npm run dev では型チェックされない。
TypeScript で、の型パズル的な実装は、まさしくパズルなので昔のテレビなら「スッキリ」ってとこでしょうか。
今回調べていてすぐにvue-plotly というラッパーを見つけていたんですが、2 年ほどメンテされていないようで最初から試しもしませんでした。
ではでは。